Page 29 - EGYPT - En Vol.4 HD
P. 29

E  gypt
             Snapshot of E  gypt                                                                                 27
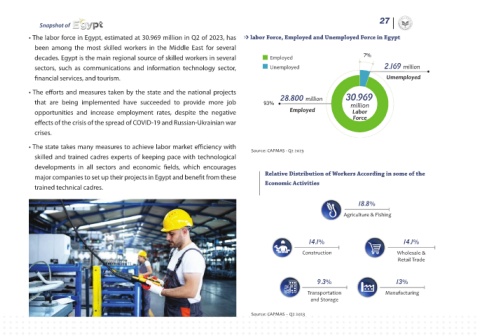
          • The labor force in Egypt, estimated at 30.969 million in Q2 of 2023, has   labor Force, Employed and Unemployed Force in Egypt
           been among the most skilled workers in the Middle East for several
           decades. Egypt is the main regional source of skilled workers in several   Employed
           sectors,  such as communications  and information  technology sector,   Unemployed                     2.169 million
           financial services, and tourism.                                                                        Umemployed
          • The efforts and measures taken by the state and the national projects
                                                                                    28.800 million     30.969
           that  are  being  implemented  have  succeeded  to  provide  more  job                        million
           opportunities  and  increase  employment  rates,  despite  the  negative    Employed          Labor
                                                                                                         Force
           effects of the crisis of the spread of COVID-19 and Russian-Ukrainian war
           crises.
          • The state takes many measures to achieve labor market efficiency with
                                                                           Source: CAPMAS - Q2 2023
           skilled and trained cadres experts of keeping pace with technological
           developments in all sectors and economic fields, which encourages
           major companies to set up their projects in Egypt and benefit from these   Relative Distribution of Workers According in some of the
           trained technical cadres.                                           Economic Activities

                                                                                                           18.8%
                                                                                                       Agriculture & Fishing


                                                                                            14.1%                       14.1%
                                                                                          Construction                Wholesale &
                                                                                                                      Retail Trade


                                                                                               9.3%                   13%
                                                                                            Transportation         Manufacturing
                                                                                             and Storage
                                                                           Source: CAPMAS – Q2 2023
   24   25   26   27   28   29   30   31   32   33   34